
Citation: Darin, E., Kashyap, R. and Leasure, D.R. (2025), How Accurate Are High Resolution Settlement Maps at Predicting Population Counts in Data Scarce Settings?. Population, Space and Place, 31: e70083. https://doi.org/10.1002/psp.70083
On April 9, 2025, alongside the Population Association of America (PAA) Conference in Washington, DC, the "Novel Approaches to Poverty and Population Mapping" workshop convened over 80 experts from across the geospatial, socioeconomic, and development sectors. The workshop was organized by CIESIN at Columbia University with the POPGRID Data Collaborative and with support from George Washington University.

CIESIN Associate Director for Science Applications, Dana R Thomson, organized an interactive workshop with the Statistical Institute of Jamaica (STATIN) in Kingston, Jamaica. The workshop was designed to foster a technical exchange among STATIN, the Economic Commission for Latin America and the Caribbean (ECLAC), the United Nations Population Fund (UNFPA), and the POPGRID Data Collaborative, with two goals: (1) Enhancing STATIN’s modeling techniques for census non-response and (2) Advancing POPGRID’s collaboration with traditional statistical agencies.
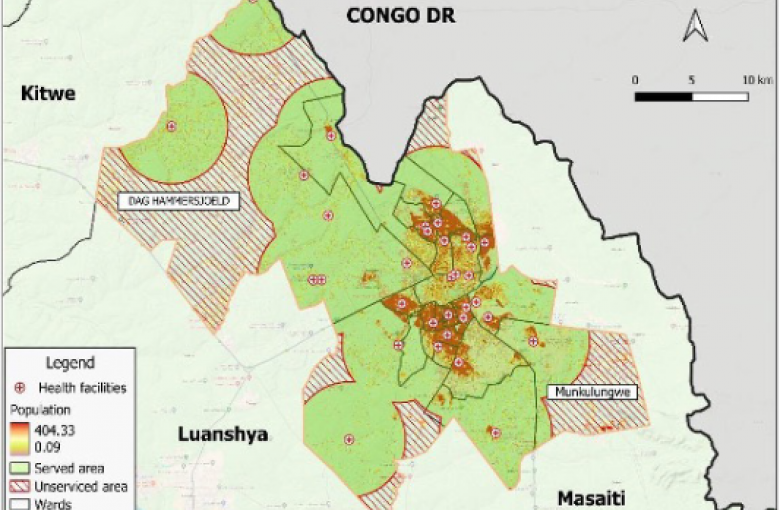
The POPGRID Data Collaborative highlights case studies from end data users and decision-makers about practical applications of gridded population datasets. Learn how gridded population datasets are being used as a population sampling frame in a national vaccination coverage survey in Lao PDR, and for urban planning in Ndola, Zambia.

Now more than ever, it is essential that we understand where people are located, what conditions they are facing, what infrastructure is available, and what basic services they can access. Fortunately, gridded population data have emerged as an important resource for delivering actionable data in challenging circumstances, including in disaster response and health and infectious disease monitoring.