Cities, crowding, and the coronavirus: Predicting contagion risk hotspots
This blog post is reposted from the World Bank's Sustainable Cities blog series. POPGRID Data Collaborative members from the German Aerospace Centre (DLR) Thomas Esch and Mattia Marconcini worked with Bank staff to develop a methodology related to Cities, crowding, and the coronavirus: Predicting contagion risk hotspots based on gridded population and settlement data, including DLR's World Settlement Footprint 3D product, Facebook and CIESIN's High Resolution Settlement Layer, and WorldPop.
Across the globe, well-functioning cities do one thing really well – they bring people together. Social and economic interactions are the hallmark of city life, making people more productive and often creating a vibrant market for innovations by entrepreneurs and investors. No country can achieve significant economic growth without vibrant cities.
But the coronavirus pandemic is now seriously limiting social interactions. With no vaccine available, prevention through containment and social distancing, along with frequent handwashing, appear to be, for now, the only viable strategies against the virus. The goal is to slow transmission and avoid overwhelming health systems that have finite resources. Hence non-essential businesses have been closed and social distancing measures, including lockdowns, are being applied in many countries.
Will such measures defeat the virus in dense urban areas? In principle, yes. Wealthier people in dense neighborhoods can isolate themselves while having amenities and groceries delivered to them. Many can connect remotely to work, and some can even afford to live without working for a time.
But poorer residents of crowded neighborhoods cannot afford such luxuries. They are forced to leave their home every day to go to work, buy groceries, and do laundry. This is especially true in low-income neighborhoods of developing countries – many of which are slums and informal settlements. Here many residents live in substandard housing and overcrowded conditions. The lack of adequate infrastructure means that they share taps and latrines, with as many as 200 people per communal facility. Most people living in these communities are daily wage earners in the informal sector, with irregular income and insecure jobs. They cannot realistically practice social distancing, nor can they afford it.

In regions such as Africa, South Asia, and Central America, the pandemic has yet to peak. Their cities, especially the densest ones, will face a great challenge, given their weak infrastructure and limited medical and financial resources. To stave off this crisis, emerging hotspots must be anticipated so that medical and civil resources can be targeted to limit diffusion into surrounding areas. Vulnerable groups need to be identified in advance, so that they can be supported to weather the storm.
To help city leaders prioritize resources towards places with the highest exposure and contagion risk, the World Bank has developed a methodology that can be rapidly deployed. This methodology identifies hotspots for exposure and vulnerability, based on:
- The practical inability for keeping people apart, based on a combination of population density and livable floor space that does not allow for 2 meters of physical distancing.
- Conditions where, even under lockdown, people might have little option but to cluster (e.g., to access public toilets and water pumps).
The analysis requires three primary datasets: population, building heights, and location of key services. Because it’s important to deploy this analysis rapidly, but local data coverage may be scarce, our methodology relies on global datasets. We retrieved the population datasets from WorldPop and Facebook, and collected data on key services from OpenStreetMap or our counterpart cities. We collected building heights data and floor space per person (at a 100m x 100m resolution) through a partnership with the German Space Agency (DLR) for a range of low- and lower-middle-income cities. This is a central piece of the puzzle, as floor space per person makes the difference between density and crowding, or between, say, Manhattan and Kibera in Kenya. Since the data structure of our algorithm is based on the grid cell, various types of spatial data can be easily brought on board.
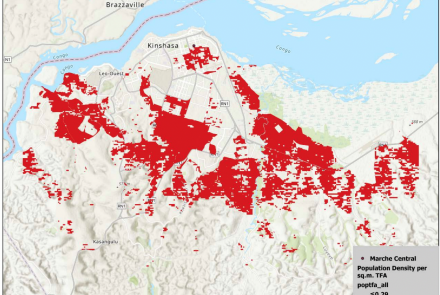
Consider the following three cities where we apply the hotspots methodology: Mumbai, Kinshasa, and Greater Cairo (Figure 2). The red areas correspond to potential hotspots: areas where the population concentration is higher than a maximum threshold to maintain social distance. In Mumbai, these cover 104.5 km2 that account for approximately 4.5 million people. In a city with an estimated total population of 20 million, we find about 20% of the population will not be able to maintain social distance and be at risk of rapid contagion, just because the built environment doesn’t allow it. In Kinshasa, the hotspots cover approximately 138 km2 placing some 5.88 million people – about 53% of the total population – at risk. In Cairo, hotspots cover almost 84 km2 , accounting for 5.5 million people or about 25% of the total population.
The reality that most of the at-risk population may live in informal settlements with poor living conditions poses additional concerns. For example, people in these hotspots may not have individual water and sanitation connections, which not only limits their ability to practice proper hygiene, but also forces them to use crowded public facilities, increasing the chances of contagion and viral spread. Some areas may also have high levels of air pollution due to the type of cooking fuel used by households or illegal dumping and burning in the area. Since air pollution can cause lung and heart disease, these people are more likely to be at risk of complications from the coronavirus.
Figure 2: Potential Exposure Hotspots.

Source: This map combines two pixel-level datasets: population data from WorldPop and heights data from the German Space Agency. The red areas represent the hotspots.
We identify a second set of hotspots, incorporating the location of key services and mobility towards them (Figure 3, in purple). For Mumbai, we use the location of public toilets as a key service that people will still use even under lockdown. We find that additional hotspots cover an extra 15 km2 often near the previous set of hotspots, and with a few new areas affected as well. These additional hotspots account for more than 600,000 people, bringing the total affected population to 5.2 million (an increase of 15% in people at risk). In Kinshasa, we use the location of water kiosks as the key service of interest. We find that additional hotspots cover an additional 32 km2 , corresponding to a 13 percentage point increase in people at risk. This brings the total number affected to 6.6 million, or two-thirds of Kinshasa’s population. In Cairo, we use the location of public toilets to find additional hotspots. These add 15 km2 (to a total of almost 100 km2), and the total number of affected people increases by about 11 percentage points (to 36% of the total population).
Figure 3: Potential Exposure Hotspots , accounting for access to basic services.

Source: This map combines two pixel-level datasets: population data from WorldPop and heights data from the German Space Agency). The purple areas represent additional service hotspots, and derived from OSM data.
To help city leaders and communities manage the pandemic, this decision support tool can provide an evidence-based approach to target emergency interventions that avoid a rapid spread of the virus in these hotspots. These include investments to improve infrastructure services on a temporary basis (e.g., additional water distribution points, portable hand washing sites, or distribution of pee-poo bags, among others), as well as long-term investments in slum upgrading that would focus on infrastructure and service delivery, land tenure security, and housing improvements. Similarly, cities can develop awareness campaigns targeted at residents of the hotspots.
And because there is a strong correlation between poverty and poor living conditions such as slums and informal settlements in many cities in the developing world, geographic targeting of such hotspots would provide a reliable proxy to means-based testing and help cities target emergency efforts to the vulnerable. Through geographic targeting, governments can provide the poor, irregular income earners and those whose livelihoods are affected by the lockdown with cash transfers, food distribution, and other support to reduce the pressure for them to choose between staying healthy and economic survival.
And as cities and societies start emerging from the crisis, governments should focus on key factors that contribute to the spread of epidemics and other public health risks: inadequate infrastructure, lack of services, and substandard housing. Density has all too often been easily scapegoated for social ills and public health issues, when in fact there are major differences between places with the same population density, make some overcrowded and insalubrious while others are compact and livable. When we reach the end of a crisis that has brought so many places in the world to a standstill, some people may need to rebuild their confidence in density.
It will be critical to combine place-based interventions, such as slum upgrading and neighborhood improvement programs, with people-based approaches focused on citizen engagement, community participation, and leveraging social organizations. After all, a socially inclusive city is going to be much more resilient to the next crisis down the road.
Related links:
- Working paper: Cities, crowding, and the coronavirus: Predicting contagion risk hotspots
- Subscribe to our Sustainable Cities newsletter
- Follow @WBG_Cities on Twitter


